Graphing Basics
A proper graph is necessary in order to allow you and others to both
interpret and analyze your data. A graph should have all the following
elements.
- Title
All graphs should have a descriptive title which describes what data the
graph is showing.
- Labeled Axes
Each axis must be clearly labeled showing the variable being measured
along with correct units.
- Origin
Always include the origin (0,0) in your graph. This will
help you to properly interpret your data.
- Data Points with Point Protectors
Data points should be plotted in the proper position. Place point
protectors (usually circles) around each data point.
- Proper Scaling
The graph must be properly scaled. Scale each axis to take up a
maximum amount of space on the page yet maintaining divisions which make
plotting as easy as possible.
- Line or Curve of Best Fit
Draw a line or curve of best fit. This line or curve should show
the overall tendency of the data. If drawing a line use a straight edge.
Never connect successive data points like you are doing a connect the
dots drawing.
- Identify Points used to Calculate a Slope
When calculating the slope of a line of best fit choose two points
that lie on the line of best fit. Do not choose data points. Mark the points you have chosen with a +.
- One Graph per Page
The graph should fill the page. Large graphs are easier to
read and easier to interpret. Draw only one graph per page.
The graph should be as large as the paper and scaling techniques will allow.
Do not try to fit a data table onto the page as well.
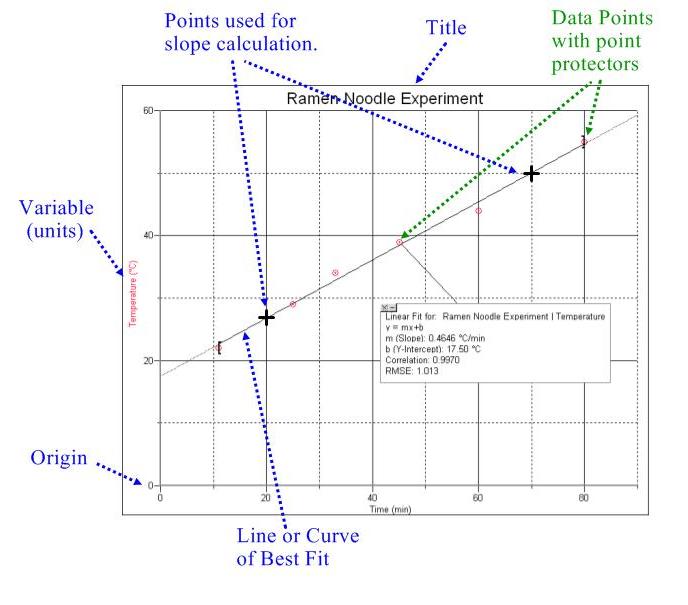
Example
Graph shown below